Brought to you by the team at Bento Bio on the mission to make DNA lab work accessible to all. We create powerful, easy-to-use devices, affordable supplies, and guides, to help anyone—from beginners to professionals—harness the power of PCR anywhere.
In this article we provide a step-by-step guide on how to assess and interpret electrophoresis gels after running PCR assays.
This resource is intended as a set of suggested steps for complete beginners and experienced users alike, taking the user thought the entire process from the first examination of a run electrophoresis gel, to a thorough analysis of any results shown.
By the end of the article you should have a better understanding, or refreshed your memory, of:
- How to record and annotate electrophoresis gels
- How to evaluate the quality of electrophoresis gels, the quality of the electrophoresis run, and how to improve it
- How to identify successful results, contamination, non-specific amplification and gel artefacts
Looking for a compact gel setup for your lab or extra equipment capacity at an affordable cost?
Bento Lab is a portable laboratory that combines 3 key tools — a thermal cycler for PCR, a gel electrophoresis unit, and a mini centrifuge — into a compact system for less than $2000.
Background to interpreting agarose electrophoresis gels
Understanding and interpreting the results of PCR experiments using gel electrophoresis is an essential skill for anyone involved in PCR work.
Gel electrophoresis is a technique that allows:
- Visualisation of amplified DNA
- Separation of DNA fragments by size
- Estimation of DNA fragment sizes and DNA concentration by comparison to a DNA ladder standard
For a background in gel electrophoresis itself, and how to do it with Bento Lab, you can read our Introduction to Gel Electrophoresis.
Interpretation of electrophoresis gels is a very important step because it is usually the primary means of evaluating PCR results, either as the final step in the experimental process, or as the last low-cost step before proceeding to more expensive sequencing procedures. When done well and with appropriate controls (see our article on Controls in PCR and PCR assays with Bento Lab), it is also an essential tool for troubleshooting issues with your DNA extraction, PCRs and workflows.
Interested in DNA methods and workflows? Subscribe for monthly insights.
Step-by-Step Procedure for Interpreting Electrophoresis Gels
Step 1: Record clear digital images of your electrophoresis gel
The first step in assessing electrophoresis gels should be to record a good digital image of the gel. Digital images allow closer inspection of very small gels; image enhancement; annotation; and storage as part of a permanent experimental record.
To record a good digital image, you can:
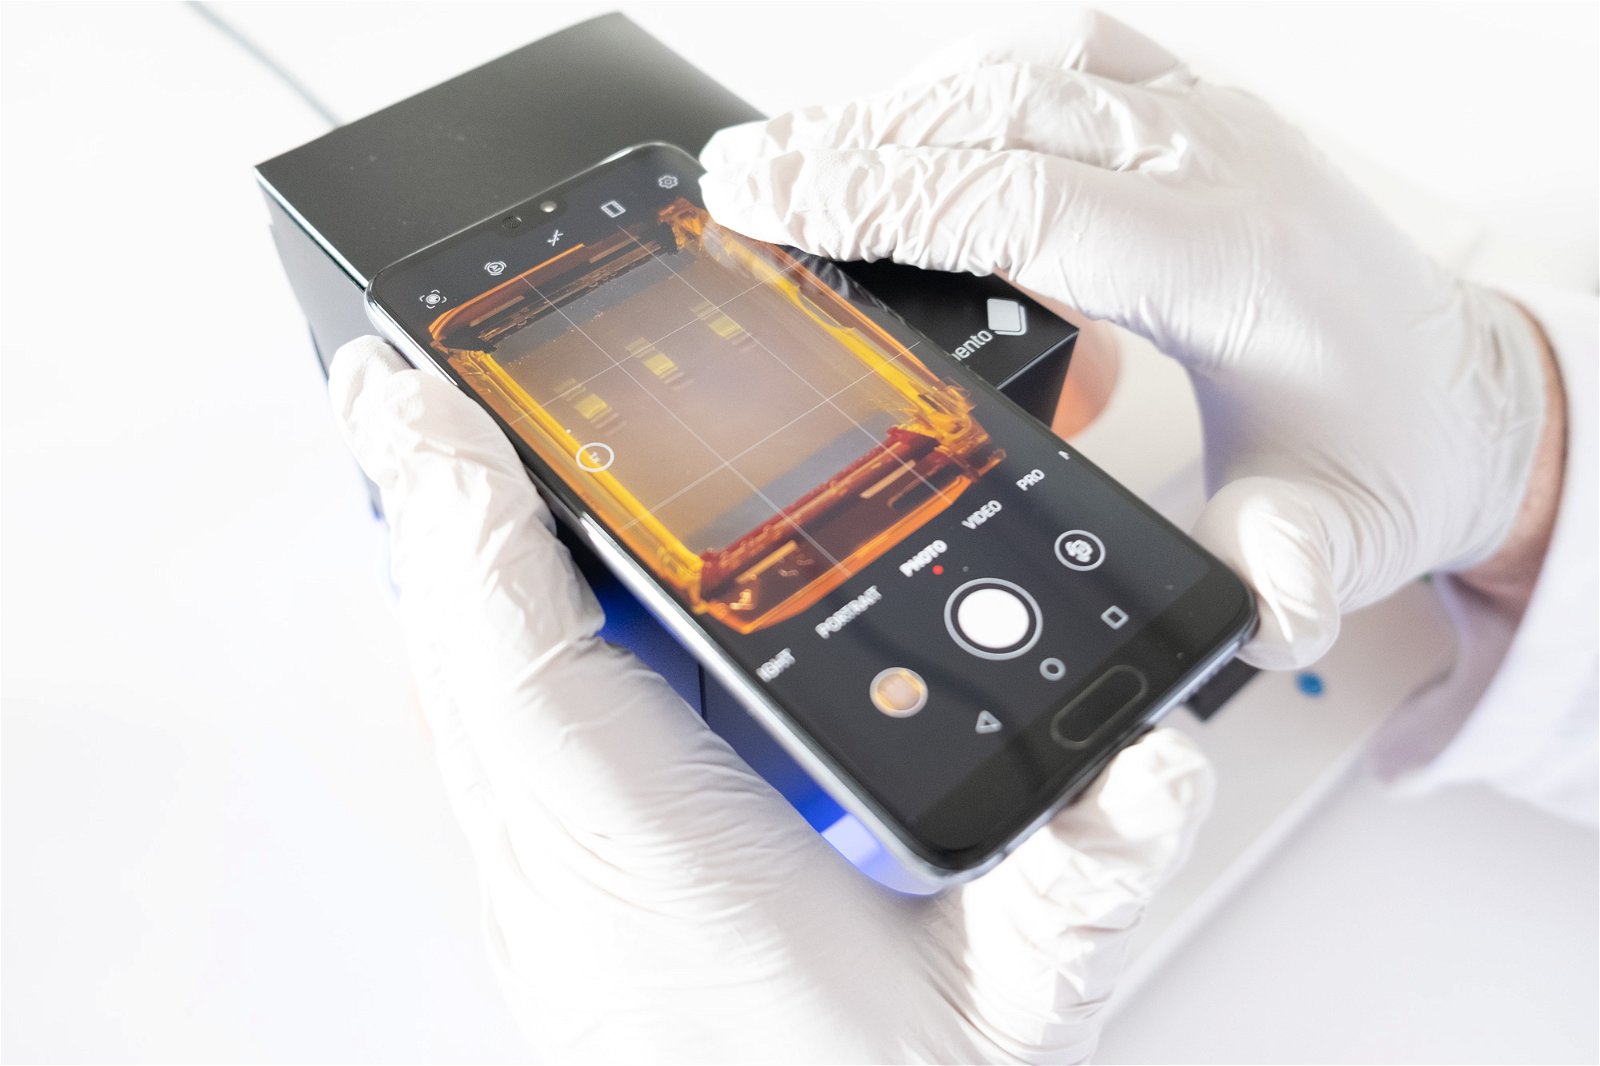
- Photograph the gel with a smartphone camera or small compact camera. A manually adjustable focus mode can help in ensuring that the focus of the images are the amplicon bands. Placing the camera lens directly behind the orange filter of the gel imaging hood or gel tank lid will produce the best images.
- Use a gel imaging hood or improvised dark box, or photograph through the Bento Lab gel tank lid in dark conditions.
- Ensure that the orange filter or orange tank lid is free of condensation — or wipe it clean with a tissue if it is not clear.
- Reduce ambient light — the darker the room, the better the visualisation.
- If excluding ambient light is difficult even with a dark box, try removing the gel and placing it on a piece of transparent plastic directly on the transilluminator, and place a gel imaging hood or dark box over it. Be careful of picking up potential PCR contamination after touching the gel, and change gloves after handling.
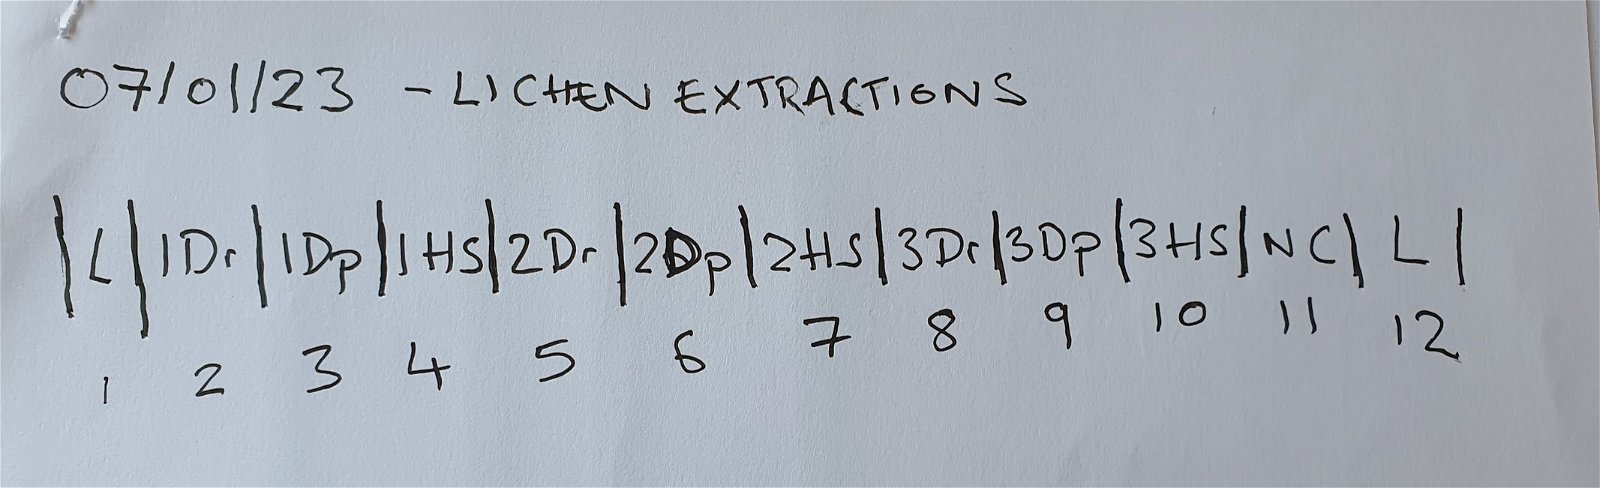
- Photograph a gel map (a diagram of which samples went into each well of the gel) from your lab book or notes before you photograph your gel. This will help you keep track of what images refer to which samples when inspecting images in the future.
Step 2: Transfer the gel images into a form you can keep and annotate as part of a laboratory book
It is always a good idea to make thoroughly documented records of experimental results. Consider pasting images into an electronic document (e.g. Google Docs or Slides) or printing out images to glue into a physical lab book. This will allow you to annotate the gel image with sample codes, results and interpretation, as part of your recorded experimental process.
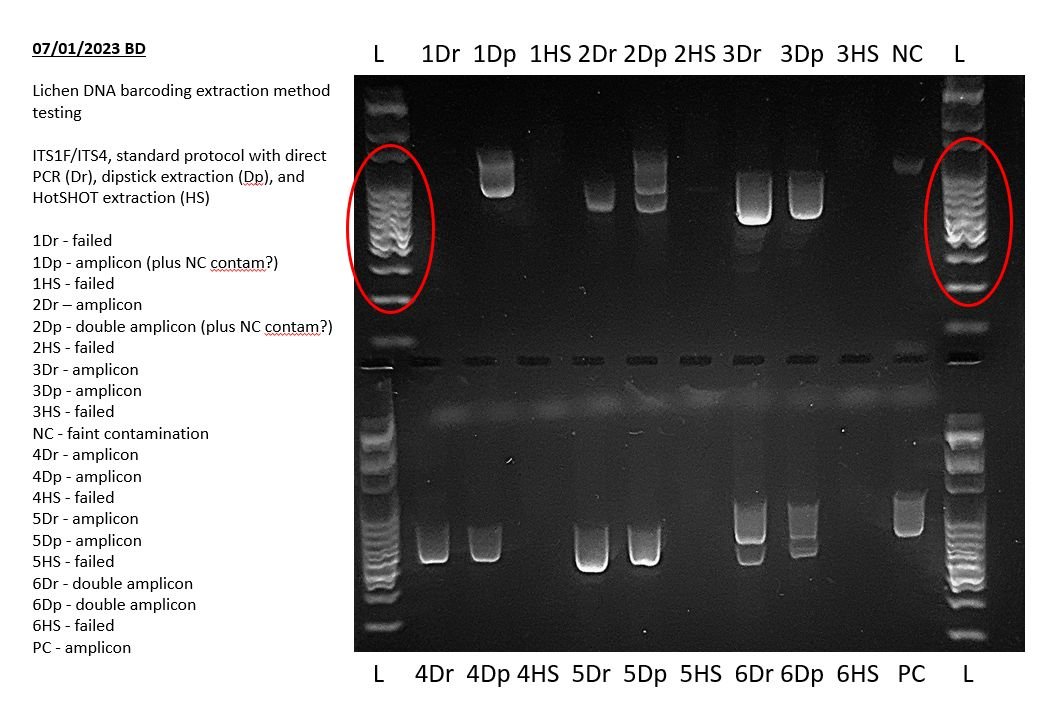
Before documenting the gel, you can adjust the gel to make it clearer and more easy to interpret. You could use phone or desktop apps to crop and rotate images, and adjust image contrast, colour saturation, and gamma intensity. You could also invert the image to a white background with dark/black bands to make some gels clearer.
Step 3: Assess the general quality of the cast gel
The physical quality of the gel can have an enormous impact on the quality of the gel image. Most physical gel issues can be observed directly after the gel is cast, but some issues are only visible after running the gel with amplicons and DNA ladder. Because of this it is always useful to quickly check the gel images for the issues in the table below.
| GEL QUALITY ISSUES | |
| Gel issue | Solution |
| Bubbles present in the gel | Leave the gel to cool before casting so that most bubbles will rise to the surface and pop. If any bubbles remain after pouring, remove them manually using a pipette tip to draw them down to the bottom end of the gel. Remove and replace the comb/s to ensure bubbles don’t cling to the side of the combs. |
| Cloudy agarose | The agarose was probably incompletely dissolved. When melting, ensure that the agarose is completely dissolved by bringing it to bubbling once, then swirling, then bring it to bubbling a second time. |
| Physical objects in the gel (dust, hairs, or even insects) | Cover the gel tank with a paper towel while it is open and while it is setting. |
| Gel melted while running (most often seen in low percentage agarose gels) | Reduce running temperature by running at a lower voltage. Run for shorter durations if possible. If a long slow run with a low percentage agarose gel is needed, try using a running buffer that allows cooler faster electrophoresis than TBE buffer (for example sodium borate, lithium borate, or lithium acetate borate) |
| DNA stain artefacts | Ensure the DNA stain is well mixed with the molten agarose and then left to sit to remove bubbles before pouring |
Step 3: Examine how the DNA ladders have run
The quality and extent of run for the DNA ladder can be used as an initial estimate of how well the gel ran overall.
The first and last lanes containing DNA ladder should have clearly visible banding in a ladder pattern, and should have run at least through the entire top half of the gel. These indicate that the gel has run successfully to the desired extent. For clearer band separation the gel can be run for longer or for the full extent of the gel.
DNA ladder bands should be as clear, distinct and crisp as possible. This may not always be possible across the full range of the ladder, but bands in the size ranges of the target amplicons should be well separated.
Poor running of the DNA ladder (e.g. faint or smeared bands, crooked running, poor separation) will indicate that you may get the same phenomena happening to your amplicons. This may or may not be a problem for your particular purposes, but it is not ideal in any case.
Smearing can be caused by:
- Loading too much DNA (this can overload the gel).
- Some DNA stains, such as Gel Green, respond more severely to DNA overloading (however, we believe the safety aspects of GelGreen outweigh this disadvantage for most beginner applications).
- Excessive heating during electrophoresis (this can soften or melt the gel and affect migration), caused by:
- Running voltage too high
- Pouring the gel too thick
- Running buffer with a lower ionic strength than the gel
- A long running time
- Running in hot ambient temperatures combined with the above
- Using insufficient running buffer.
It should be noted that there are some limitations in the resolution of bands in minigels compared to those in substantially larger gel electrophoresis units.
| DNA LADDER RUNNING ISSUES | |
| DNA ladder running issue | Problem and solution |
| The ladder has not run far enough | Run the gel for longer periods |
| The ladder has smeared | You may be loading too much DNA – try running a lower volume of DNA ladder. Smearing can also occur with some DNA stains due to the dyes affecting DNA migration. |
| The ladder has poor band separation | Run the gel for longer periods. Optimise the agarose gel density for an appropriate percentage agarose for your target amplicons. |
| The ladder is not clearly visible | Check that you haven’t mis-pipetted the agarose and that it settled into the well before running. If neither amplicons or ladders are visible, then check that you have added DNA stain. Check that your gel has not been overexposed to light which may have exhausted the fluorescence capacity of the DNA stain. If none of those appear to have caused the problem then your DNA stain may have degraded or precipitated. For some DNA stains (such as GelGreen), dye precipitation can be reversed by heating the tube in hot water at 45-50°C for several minutes and shaking well. |
| The ladder has run crooked | Check that your gel was set and run on a level surface – you could use a spirit level or spirit level app on a smart phone. Check the electrode wires in your gel tank to see if they are straight — if they are not then straighten then carefully avoiding any damage to the wire. Check that the electrodes have not been covered in agarose gel due to leakage past the rubber dams when casting the gel. |
| The ladder is present in lanes where it is not supposed to be | Mis-pipetting of ladder into the target well can result in the ladder DNA entering other wells or landing on the surface of the agarose gel, causing a faint ghosting effect. To avoid this you can try to pipette more carefully. |
Step 4: Understand the DNA ladder
The DNA ladder allows the user to estimate the length of amplified DNA fragments in nucleotide base pairs by comparison to adjacent DNA ladders run at the same time as your PCR products.
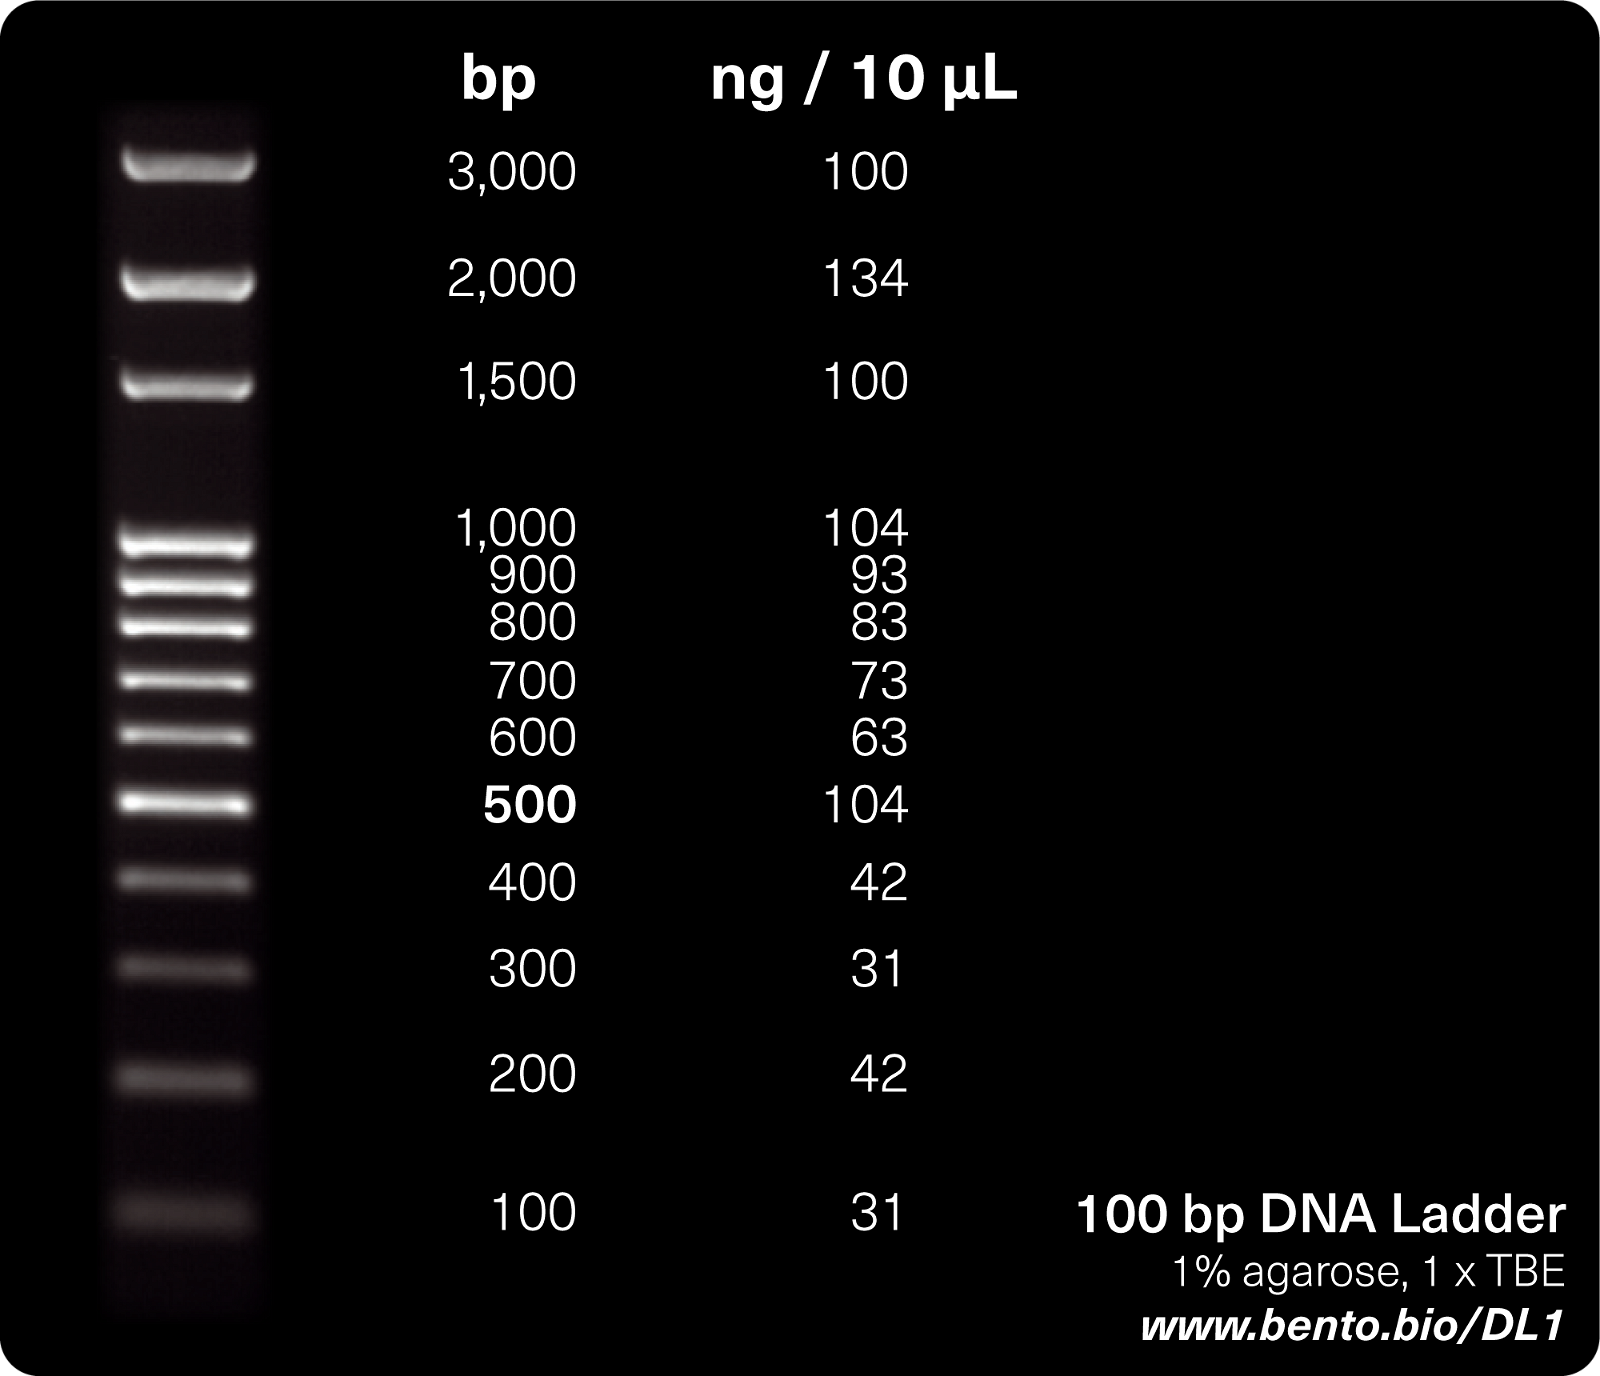
The 100 bp DNA ladder contains a set of predetermined DNA fragment sizes ranging from 100 to 1000 in 100 bp increments, then (in some ladders) 1500, 2000, and 3000. Each band is provided in a particular concentration (ng DNA/unit volume). Consult the product information for your DNA ladder for specifics on the band size and concentrations.
The smallest bands are at the bottom of the gel (smaller DNA fragments run through the gel more quickly than larger fragments), the larger bands are at the top.
To estimate the size of your PCR amplicon, you can plot an imaginary line to the right or left of your amplicon and see how far it is up the ladder scale. For example, if it is half way between the fifth and sixth run on a 100 bp DNA ladder, then the size of your amplicon will be around 550 bp.
For best comparability of ladder to samples, you can run DNA ladder in the first and last wells within a gel, or adjacent to any PCR products if only a few are being examined. A middle lane of ladder could also be run to detect any differences in migration rate at the middle of the gel compared to the edges. This will help you detect any abnormalities in the straightness of the gel run and to allow better size estimation of amplicons.
Interested in DNA methods and workflows? Subscribe for monthly insights.
Step 5: Check that the negative control is blank
You will hopefully have used a negative PCR control in your PCR to detect contamination in your PCR reagents or workflow. This lane should be blank. You can read more about controls in our article on Controls in PCR and PCR assays with Bento Lab.
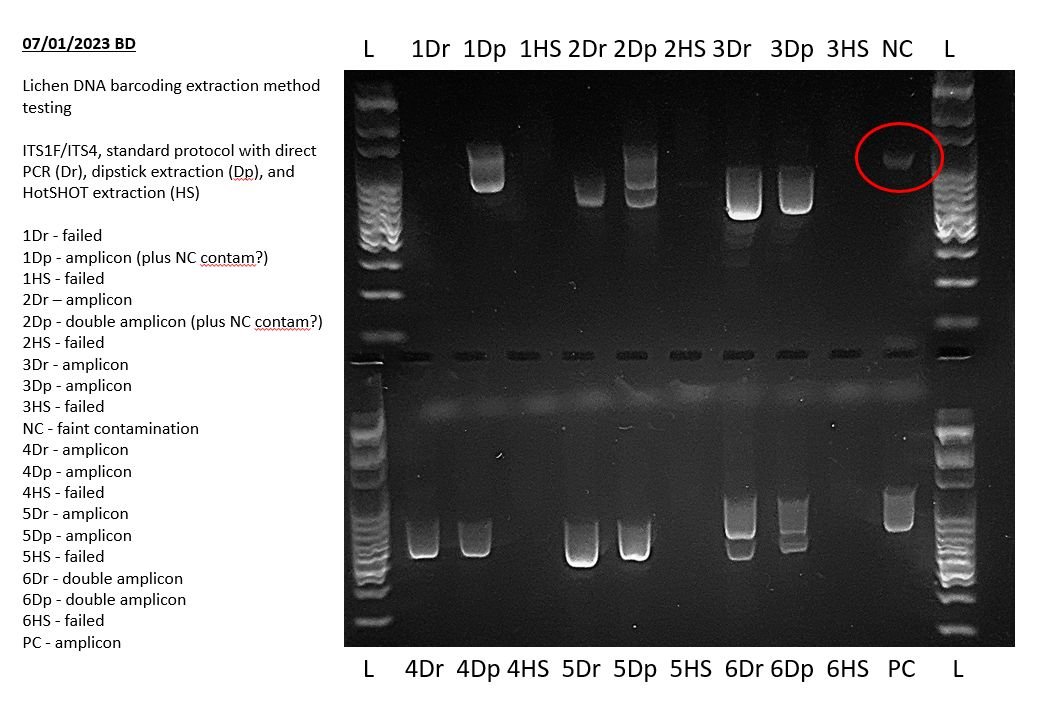
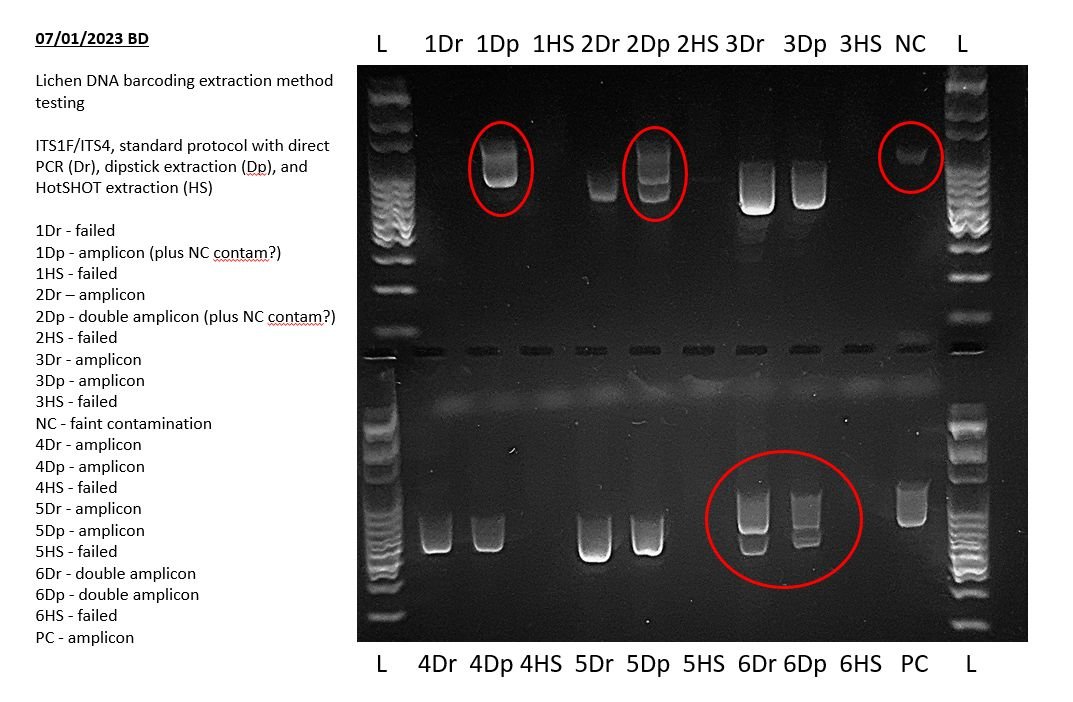
If a band is present in the negative control (other than residual primers at below 100 bp in size) then your PCR mix or workflow was contaminated. If the band is faint and is not evident in other PCR products this may not be a major issue, but you should carefully check your reagents and workflow for PCR contamination and decontaminate as appropriate.
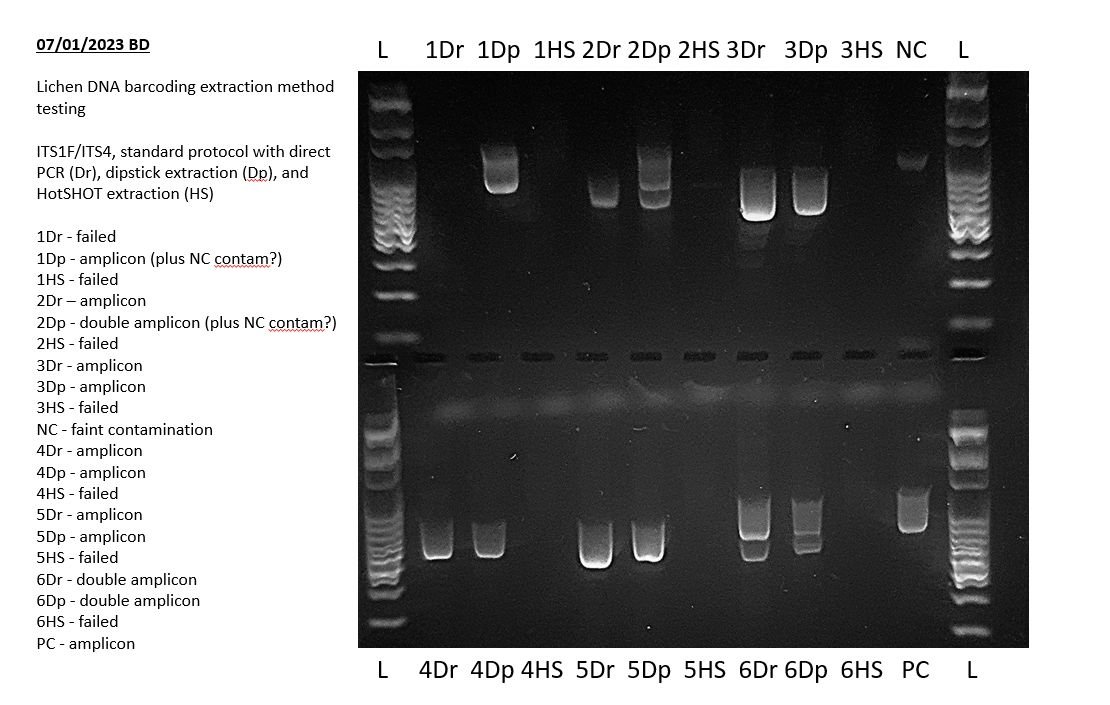
The above example shows a very faint positive result in the negative PCR control during a lichen barcoding exercise. This indicates that some of the results of this experiment may not sequence well and may need to be repeated. Specifically, any bands of the same size in other lanes may indicate that those PCRs also amplified this contaminant sequence.
Step 6: Check that the positive control was successful
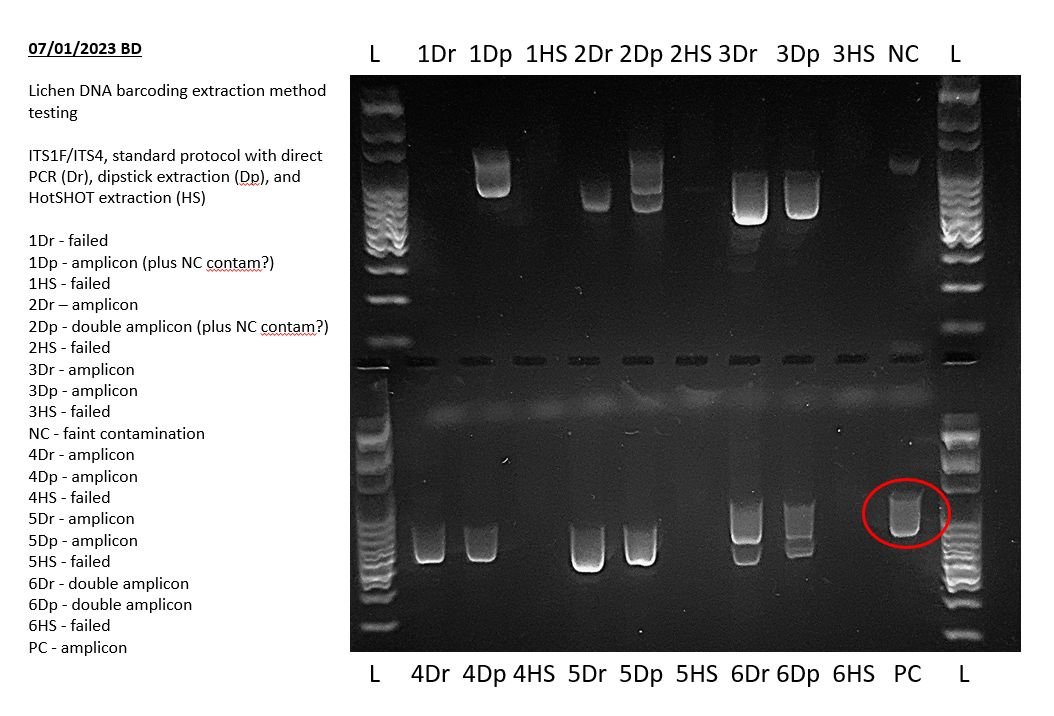
If you are using a positive PCR control (recommended if you are encountering PCR failures, or for routine use when possible), you will have included a DNA template from a known sample that produces a known result when run. Check that the known result is present in its expected well, and that it is a clear bright amplicon.
If the positive control failed, and all your sample PCRs failed, then that suggests an issue with the PCR.
For more information on controls, you can consult our article on Controls in PCR and PCR assays with Bento Lab.
Step 7. Check that your sample PCRs worked well
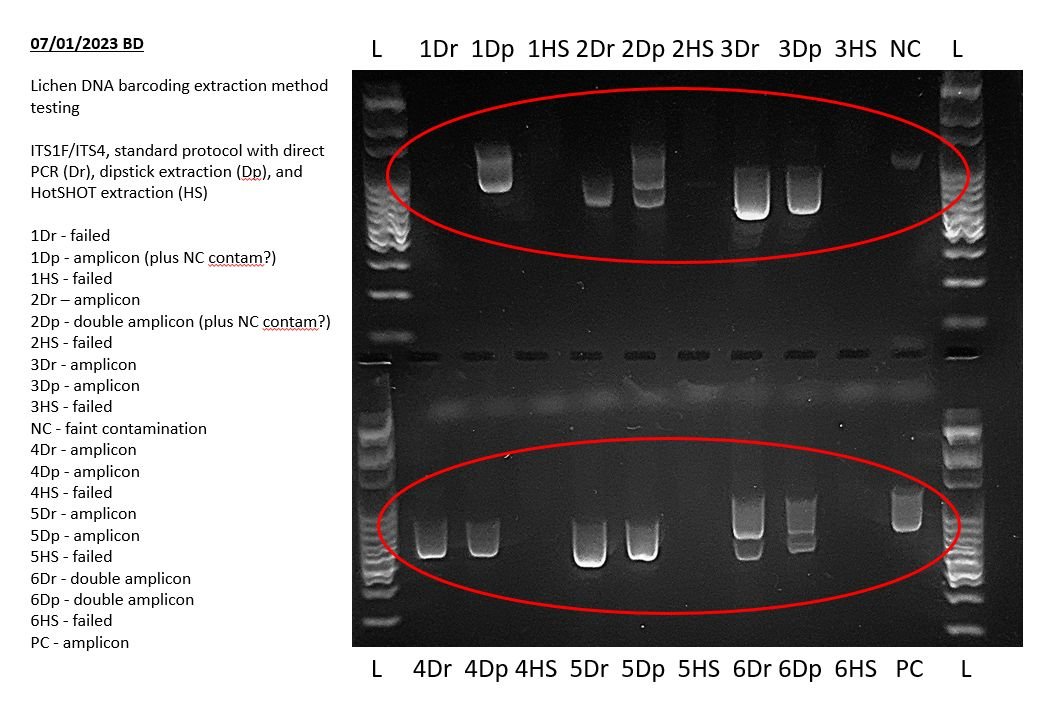
Before you began your experiment you should have had some expectation of the results of your PCR assay, for example a single amplicon band of a given size, one or two amplicon bands of different sizes, or a range of different amplicon band sizes. For example, in the gel image above from a lichen barcoding exercise, amplicons were sizes between ~500 bp and ~1100 bp. Consult the protocol for your PCR assay for more information of what to expect.
At least some, and hopefully most, of your sample lanes should contain amplicons corresponding to expected results. Different samples may produce amplicons of different sizes for the same target regions, depending on your specific PCR assay.
You may also see the following artifacts:
- Bright bands of under 100 bp in size. These are likely to be residual primers or primer dimers, unless these are expected as part of your PCR assay.
- Larger unexpected bands. These are likely to be non-specific amplification, especially if they contain long smears instead of discrete bands.
- PCR products that have entirely or partially stuck in wells, accompanied by smears. These may be caused by non-specific amplification or by physical or chemical obstacles to migration.
See our resource on Troubleshooting Non-Specific Amplification for more details of the above.
If you have no successes at all, then you can use your positive control to identify if it was a systemic PCR problem. If the positive control failed then there was probably a PCR issue. If the positive control was successful there was probably a DNA extraction issue with your samples. See our resource on Controls in PCR and PCR Assays for more information.
If most of your samples worked as expected but some didn’t, then the ones that didn’t may not have amplified due to either insufficient template DNA present or PCR inhibition caused by residual PCR inhibitors from the DNA extraction. If most of your samples were of the same subsample size and in good condition, then PCR inhibition may be more likely, and the extract may need dilution before use as a DNA template in PCR.
Step 8: Check for uneven running of the gel
When assessing your PCR results, you may notice that the PCR products and DNA ladder do not always run perfectly evenly across the gel, and can run slightly askew or with the middle lanes running faster than those at the edge.
This is in part a limitation of small mini-gel tanks and gels, and it may be more pronounced if you run your gels faster than recommended. Better quality gels may be achieved by running the gel at a lower voltage for a longer amount of time.
Crooked running of gel lanes can also be caused by gel tank electrodes becoming misaligned. If this occurs then check them and straighten them if possible, taking care not to damage them.
Step 9: Check for missing bands in multiplex PCR assays
If you are expecting multiple bands in your electrophoresis gel but only see one, then you may be experiencing some form of PCR bias or amplicon dropout.
PCR bias is a phenomenon that can occur whenever multiple amplicons are targeted in a PCR but they exhibit different amplification efficiencies. For example, this may result in an expected two bands on a gel being visible as only one band, or as one very strong and one very weak band.
A similar phenomenon that can result in missing bands is called allelic dropout. This is a phenomenon where two gene variants (alleles) are being amplified from the same organism in the same reaction, but one fails to amplify, resulting in a false result of homozygosity. The possibility of allelic dropout is an important reason why PCR-based medical diagnostics make extensive use of multiple controls and standardised procedures.
Well-designed PCR assays are experimentally optimised to reduce PCR biases before publication, and so provided the protocols are followed precisely then this should not be a major issue for the majority of assays.
Step 10: Check for unexpected double bands, primer dimers, and PCR artefacts
If your gel is showing unexpected numbers of amplicons (for example double bands in single band PCRs), or smears or other unexpected results, then your PCR may have suffered from either contamination or non-specific amplification.
You can compare additional bands in your results with your negative control to see if there is systemic contamination. For example, in the example above, there is a trace contaminant in the negative control (NC) that is possibly showing in PCR products 1Dp and 2Dp.
If any double bands are not caused by systemic contamination, then you can then consider the most likely possible causes. In the example above, the most likely explanation is co-amplification of additional fungal species present within the lichens which were being barcoded.
For more information on non-specific amplification you can read our article on Troubleshooting Non-Specific Amplification with Bento Lab.
Conclusion
Interpretation of electrophoresis gels is a very important part of assessing the results of your PCRs, and detailed inspection can provide a lot of information about your results, and what is working well or badly in your experimental method.
By examining your electrophoresis gels in a systematic, step-by-step process, you can:
- document your gels
- annotate your gels
- assess gel and gel run quality
- assess the success of positive and negative controls
- assess your results, and check for missing bands
- check for unexpected results such as unexpected bands, contamination, and non-specific amplification
This should help you assess your PCR results with more confidence, identify problems, and produce reliable results in your experiments!
Please let us know what other resources, advice, and tips and tricks for using Bento Lab that you would like us to produce in the future!
Looking for advice on using Bento Lab?
Book a free consultation or ask a question.A compact, field-ready PCR setup for < $2000?
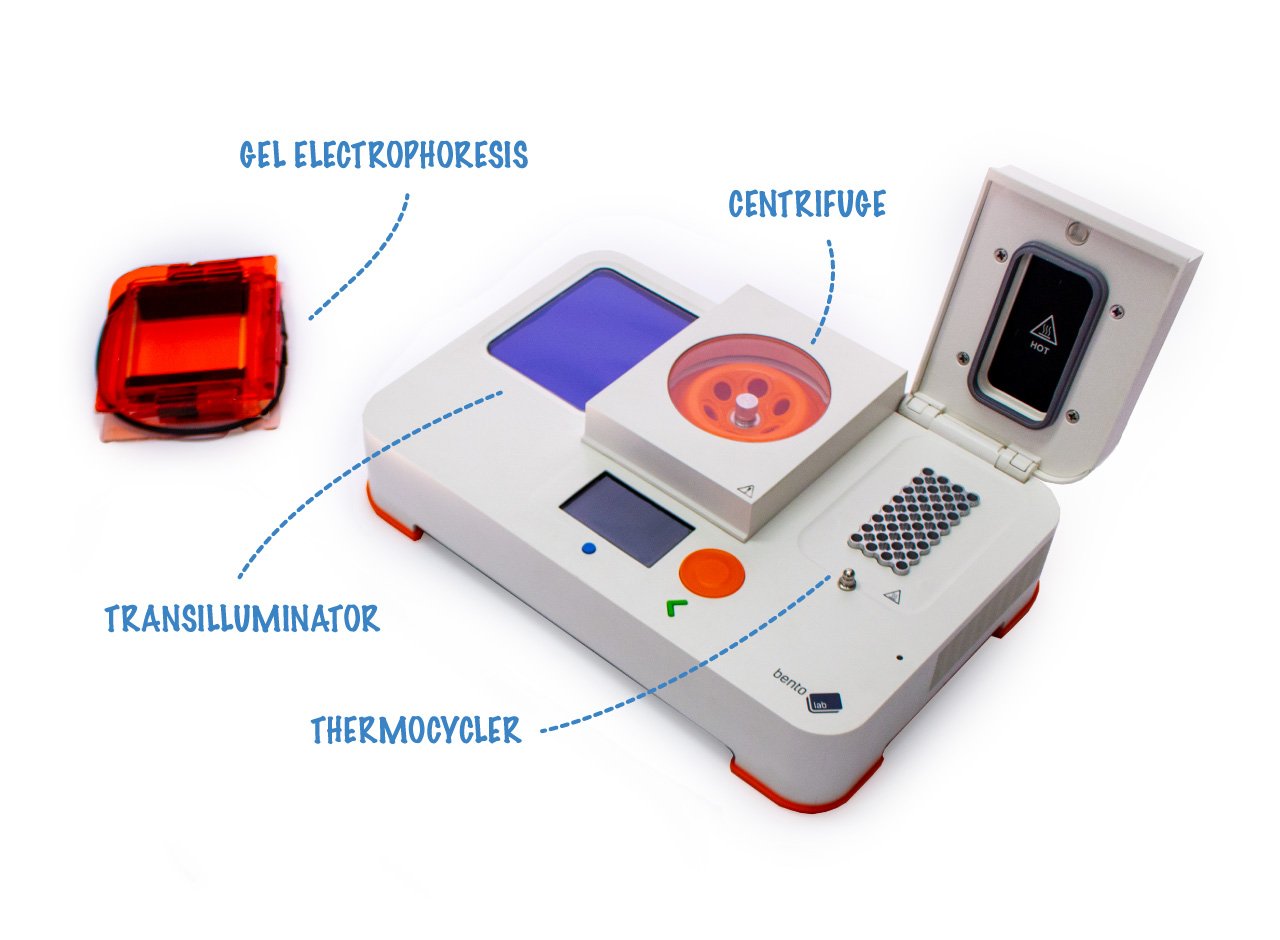
Bento Lab is a portable laboratory that combines 3 key tools — a thermal cycler for PCR, a gel electrophoresis unit, and a mini centrifuge — into a compact system for less than $2000.