Meat Detection

Beef vs Pork

Reagents

Consumables

Equipment

Abstract

In this project, we are conducting species identification, to determine whether a meat samples contains beef or pork meat. To do this, we will examine the Cytochrome b gene, which is found in the mitochondria of all species. Mitochondrial DNA is commonly used for species identification because the mitochondrial DNA remains more intact than genomic DNA when the food is processed.

What are we testing?

The Cytochrome b gene varies slightly across species, including in size. This experiment takes advantage of that feature, as we will amplify the same gene for both species, but the DNA fragment produced will be of different sizes, which allow us to infer what species are present.

Overview

What are the possible results for this experiment?

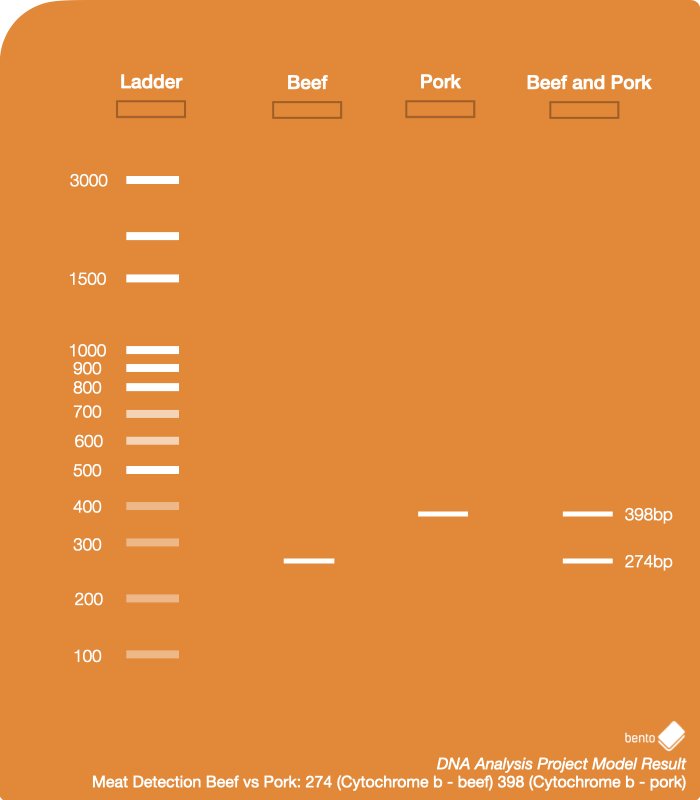
The Cytochrome b gene is specific to different species. With the primers in this experiment we can determine the presence of the Cytochrome b gene for beef, and the Cytochrome b gene for pork.

There are two possible bands. If the sample is pure beef, we will only observe one DNA band for the bovine gene. If there is presence of pork, we will see a DNA band for the gene unique to pigs.

  • Beef: the cow version of the Cytochrome b gene has been successfully copied, there is beef in the sample, and the PCR reaction has worked.
  • Pork: the pig version of the Cytochrome gene has been successfully copied, which suggests  there is presence of pork in the sample.

Protocol

In this project, you will first extract DNA from tissue samples. This will take about 20 minutes. After this, you will use PCR to amplify two variations of the Cytochrome b gene. This will take about 90 min, but most of it will be waiting time.
Finally, you will visualise the results using Gel Electrophoresis, which will take about 45 min.
At the end of each section, you can continue right away, or store your samples and continue later.

  1. DNA Extraction

    First, obtain the DNA sample. Use the DNA Extraction from tissue. It will take ca 20 min, at the end of which you should have a clean DNA template sample in a PCR tube.

  2. PCR

    In this step, you will use PCR to amplify the Cytochrome b gene.

    The experiment uses a version of DNA barcoding, where the same target DNA sequence across different species is examined to identify the species present.

    You will need the DNA template sample (1), an empty PCR tube (2), the primer mix for this project (3), the 5x PCR mastermix (4), and PCR grade water (5). The total final volume of your tube will be 20 μL.

    First add the mastermix. Set your micropipette to 4 μL.

    Using a fresh pipette tip, transfer 4 μL of the 5x PCR master mix into the empty PCR tube. Then discard your tip.

    Next add the primer mix. Set your micropipette to 2 μL. Using a fresh pipette tip, transfer 2 μL of the primer mix into the PCR tube. Then discard your tip.

    Now add the DNA template. Set your micropipette to 2 μL.

    Using a fresh pipette tip, transfer 2 μL of the DNA template sample from the sample tube into the PCR tube with the mastermix and primer mix. Then discard your tip.

    Finally add PCR grade water to make the total volume up to 20 μL. Set your micropipette to 12 μL.

    Using a fresh pipette tip, transfer 12 μL of PCR grade water into the PCR tube. Then discard your tip.

    Place your PCR tube in the thermocycler block.

    Set up the thermocycler with the following PCR program:

    If you need help operating the Bento Lab thermocycler, check the manual. You can use the PCR  preset (1), then modify (2) the program to the required settings (3) before running the program (4). This figure shows example settings – please consult the specific protocol for recommended PCR program settings.

    The program will run for ca 2 hours. When it is finished, you can keep the result in the freezer, or use it right away for gel electrophoresis.

  3. Gel Electrophoresis

    Follow the Gel Electrophoresis Protocol to cast a gel and run it with your PCR result, and a 100bp ladder. This should take about 40 min.

  4. Visualising the Gel

    You can now visualise your gel by placing it on your Bento Lab’s blue light transilluminator.

    For best visualisation you can use a smartphone camera to take an image of the gel using the Gel Imaging Hood (included with Bento Lab)

    To do this, place the gel tray open on the blue transilluminator (being careful not to spill any of the running buffer), and place the assembled Gel Imaging Hood over the gel tray.

    For ideal visibility, imaging should be done away from direct light. The darker it is, the better the contrast will be.

    If your Bento Lab transilluminator is in direct light, you can block out some of the incoming light with one hand against the Gel Imaging Hood to get better contrast.

    On the Bento Lab interface, you can turn the transilluminator light on by selecting the light bulb icon (1) and clicking the orange wheel button.

    You can also increase and decrease the intensity of the light by selecting the light bulb icon, holding down the orange wheel button with two fingers, and rotating it left or right.

    By placing your smartphone camera lens over the orange filter at the top of the Gel Imaging Hood and activating your phone camera, you will be able to see the bands of DNA fluoresce in the gel. You can then take a digital photograph to document your gel results.

    If you have a smartphone with a “Pro” camera mode, you could try manually adjusting the focus so that it focuses exactly on the bands of interest to get a better image.

    Another way of visualising the agarose electrophoresis gel is to use the orange lid of the electrophoresis tank as a filter for visualisation. This method is best suited for use in a dark room, or for a quick visual check while the gel is running.

    To do this, first remove the lid and wipe away any condensation (if it is present), and then replace the lid. Through the orange lid, you will be able to see the bands of DNA fluoresce at their positions in the gel.

    To photograph the gel using the orange lid, remove the lid, wipe away any condensation, and hold it over your phone’s camera lens to take a picture and document your experiment’s results. However, the contrast will be inferior to images using the Gel Imaging Hood unless the room is very dark.

  5. Analysing your results

    Compare the picture of your gel to this example result, which has been run with all variations. Your sample should correspond to one of these variations.

    1 – Ladder – 100 bp DNA Ladder

    2 – Beef
    Cytochrome b, beef variation (274 bp)
    This result shows presence of the bovine gene, which confirms that our sample includes beef. There is no DNA band for the pig gene.

    3 – Pork
    Cytochrome b, pork variation (398 bp)
    This result shows the presence of the pig gene. This suggests your sample is 100% pure pork meat.

    4 – Beef and Pork
    Both Cytochrome b variations: Beef (274 bp), Pork (398 bp)
    This result shows both the presence of the cow gene and the pig gene. This suggests it’s possible that both types of meat are in the sample.

    After you have taken good photos of the gel for your documentation, you can dispose of the gel in your regular trash.

    Disposal of agarose gels is a standard waste disposal procedure followed by research labs. If you have questions, get in touch with us.