This protocol is intended for customers who have not encountered sequencing data before and presents a simple step-by-step guide to identifying sequences from a .seq file that you will receive in an email once your samples have been sequenced.
You will also receive a .fasta file in this email, which more experienced users can process through analysis pipelines available online.
Receiving sequencing data
If you have ordered your sequencing reactions from Bento, you will receive your sequencing data per email as both .seq and .fasta files, along with a report on how well your samples have sequenced.
Sequencing report
The sequencing facility provides the following information for each sample:
Quality Score (QS) – this score is an average of the Quality Values (QV) for each base in the sequence. QV indicate the sequencer’s confidence in a base call being correct. QS of >40 is an automatic pass, QS of 25-39 means the sequence needs manual review, and QS of <25 is a failed sequence.
Contiguous Read Length (CRL) – this is the longest uninterrupted stretch of bases that have a QV above 20 (equivalent to a 1% Probability of Error).
Analysis Result – a reason will be given if the sequence has a low QS or CRL.
Don’t be put off if you don’t understand these results! We are happy to talk you through them, and you will get a feel for what they mean the more samples you send for sequencing.
Opening your .seq file
When you open a .seq file in Windows it will automatically open in Notepad.
To open a .seq file on a Mac, drag it into TextEditor.
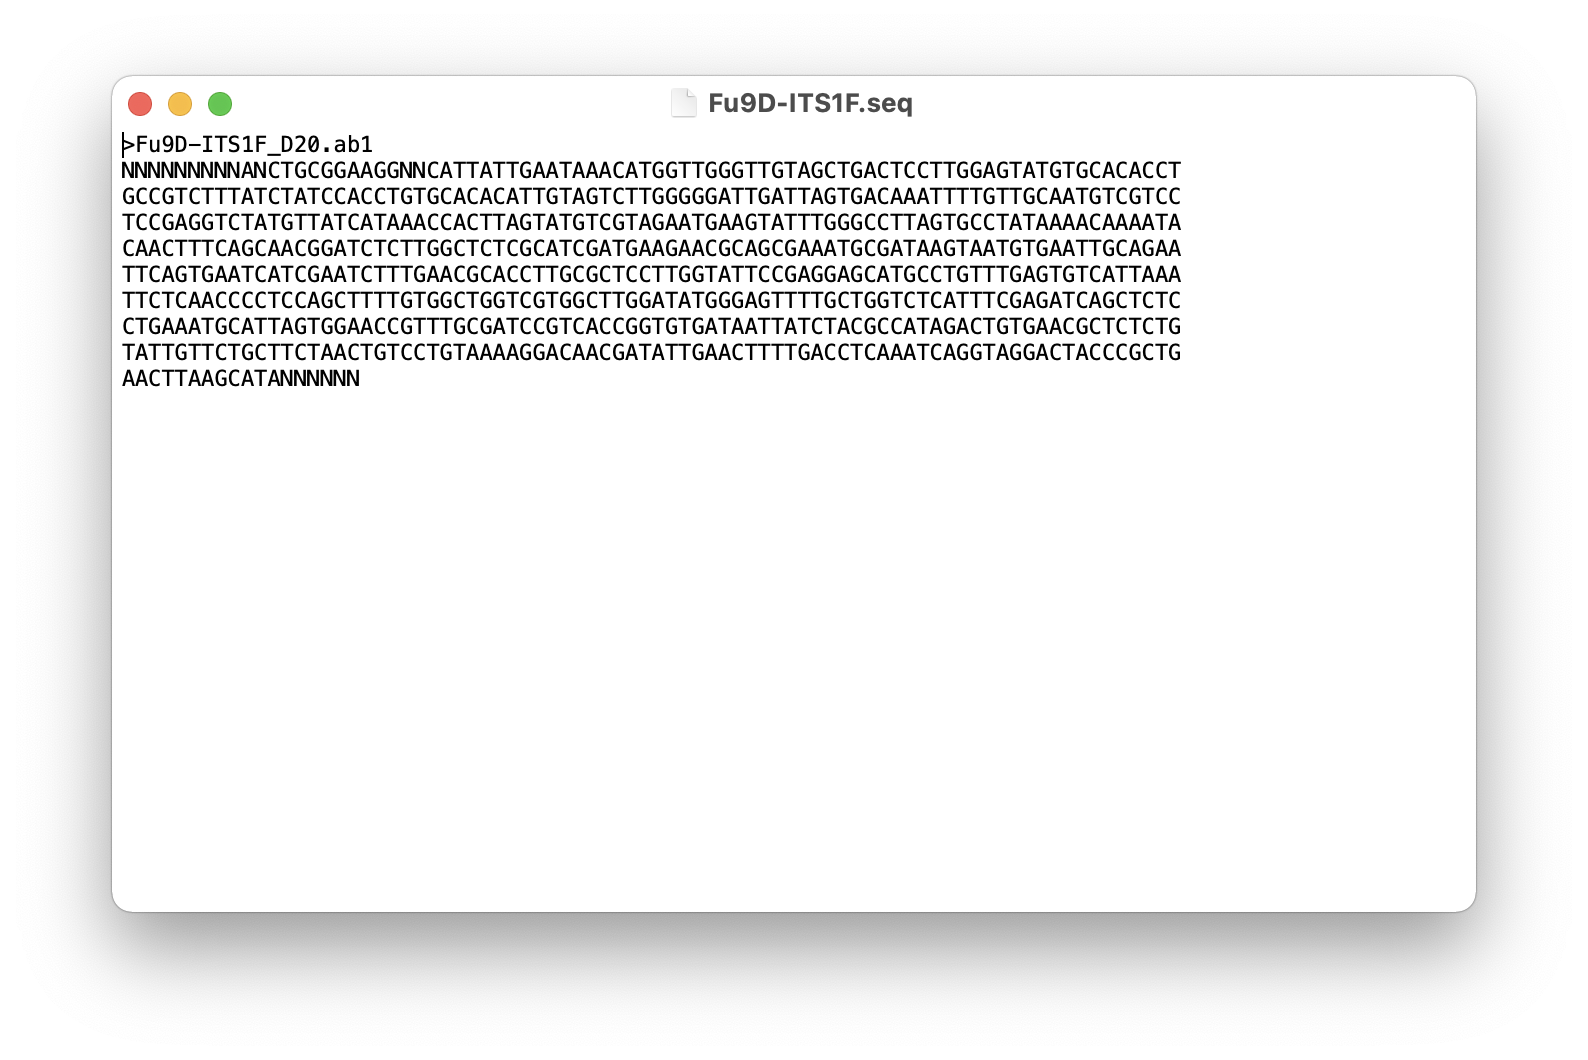
The first line, starting with >, will be the barcode number of your sample followed by the name of the primer used to sequence the sample.
Subsequent lines, made up of Ns, As, Ts, Cs and Gs, are the DNA sequence for your sample.
Often, sequences will start and finish with Ns, which are failed base calls. You want to include as few Ns as possible when you compare your sequence to the reference database.
Highlight and copy the section of the sequence you wish to use.
Highlighted in blue is an example selection of the sequence to include as few Ns as possible.
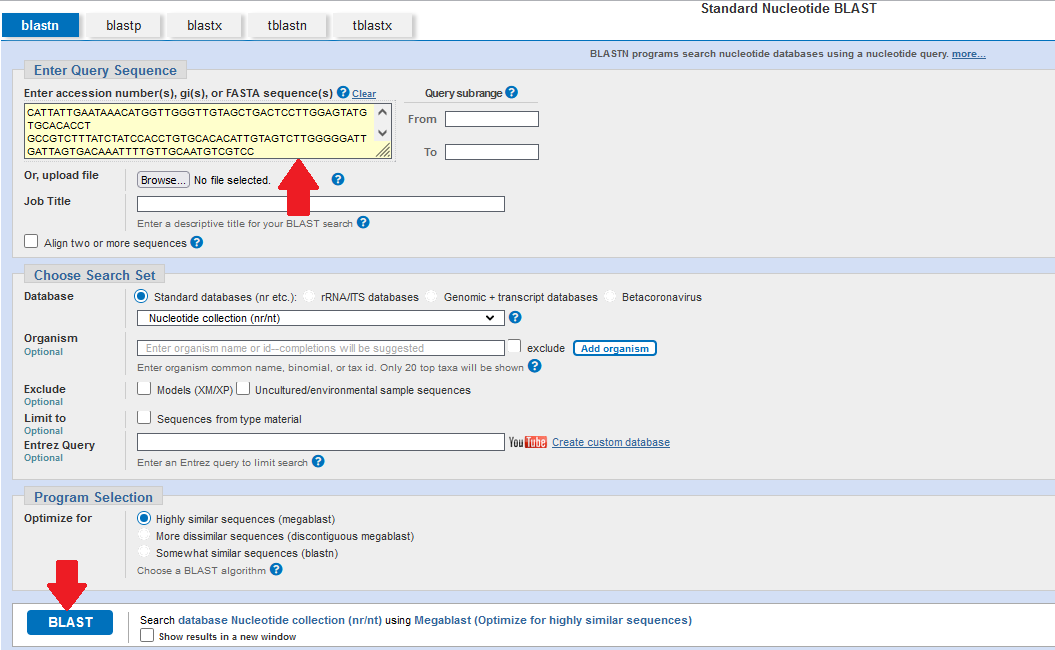
The National Center for Biotechnology Information (NCBI) has a comprehensive database of genetic data and it is straightforward to compare your sequence to these data using their Basic Local Alignment Search Tool (BLAST).
Paste your copied sequence into the yellow box at the top of the page, and then click the blue BLAST button at the bottom of the page.
BLAST will then search through the NCBI database and show you the sequences that match closely to yours.
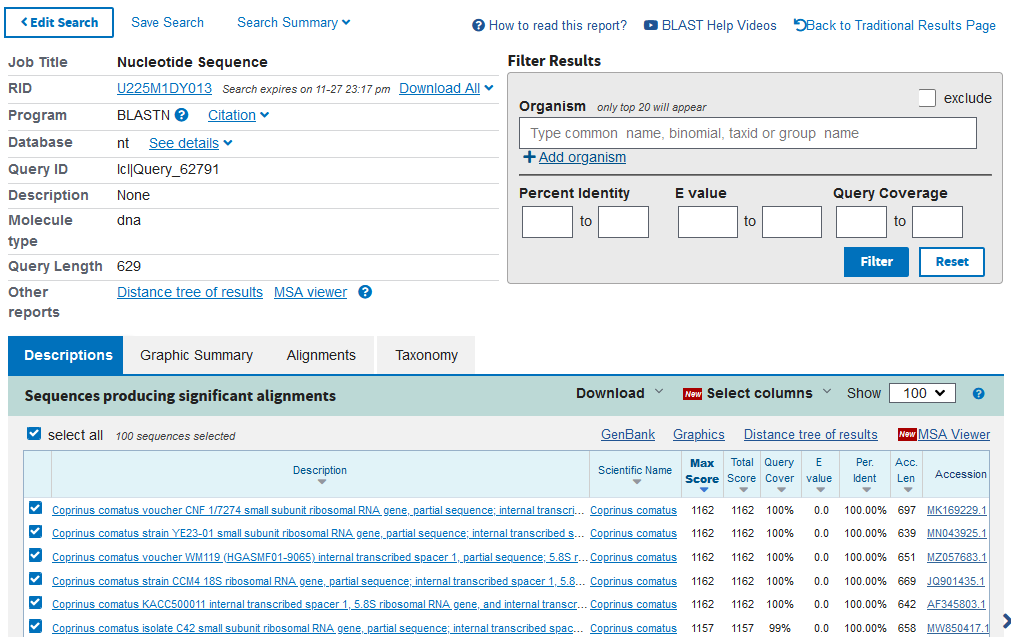
In the output you will see:
Description – the description of the matched database sequence
Scientific Name – the scientific name of the matched database sequence
Max Score – the highest alignment score (greatest number of bases that match) between your sequence and the database sequence
Total Score – sum of all alignment scores between your sequence and the database sequence
Query Coverage – the percentage of your sequence that matches to the database sequence
E value – the number of matches to your sequence you may expect to see by chance
Percent Identity – the percentage of bases that are identical between your sequence and the database sequence when they are aligned
The closer the Query Cover and Percent Identity are to 100% and the E value is to 0.0, the greater the confidence you have in the match between your sequence and the database sequence. This means you can identify your sample as the Scientific Name of the database sequence.